Бесплатный урок с нашим репетитором!

Узнать подробнее

Новая Школа - онлайн-школа подготовки к ЕГЭ
При поддержке
Посмотреть все вопросы нейросети
Бесплатный пробный урок с репетитором

Узнай больше про репетиторов Новой Школы и запишись на бесплатный пробный урок. Мы проверим твой уровень знаний и составим план обучения по любому предмету и классу

Вопрос от Анонимного юзера 24 января 2025 19:25

2•2
Ответ нейросети

24 января 2025 19:25

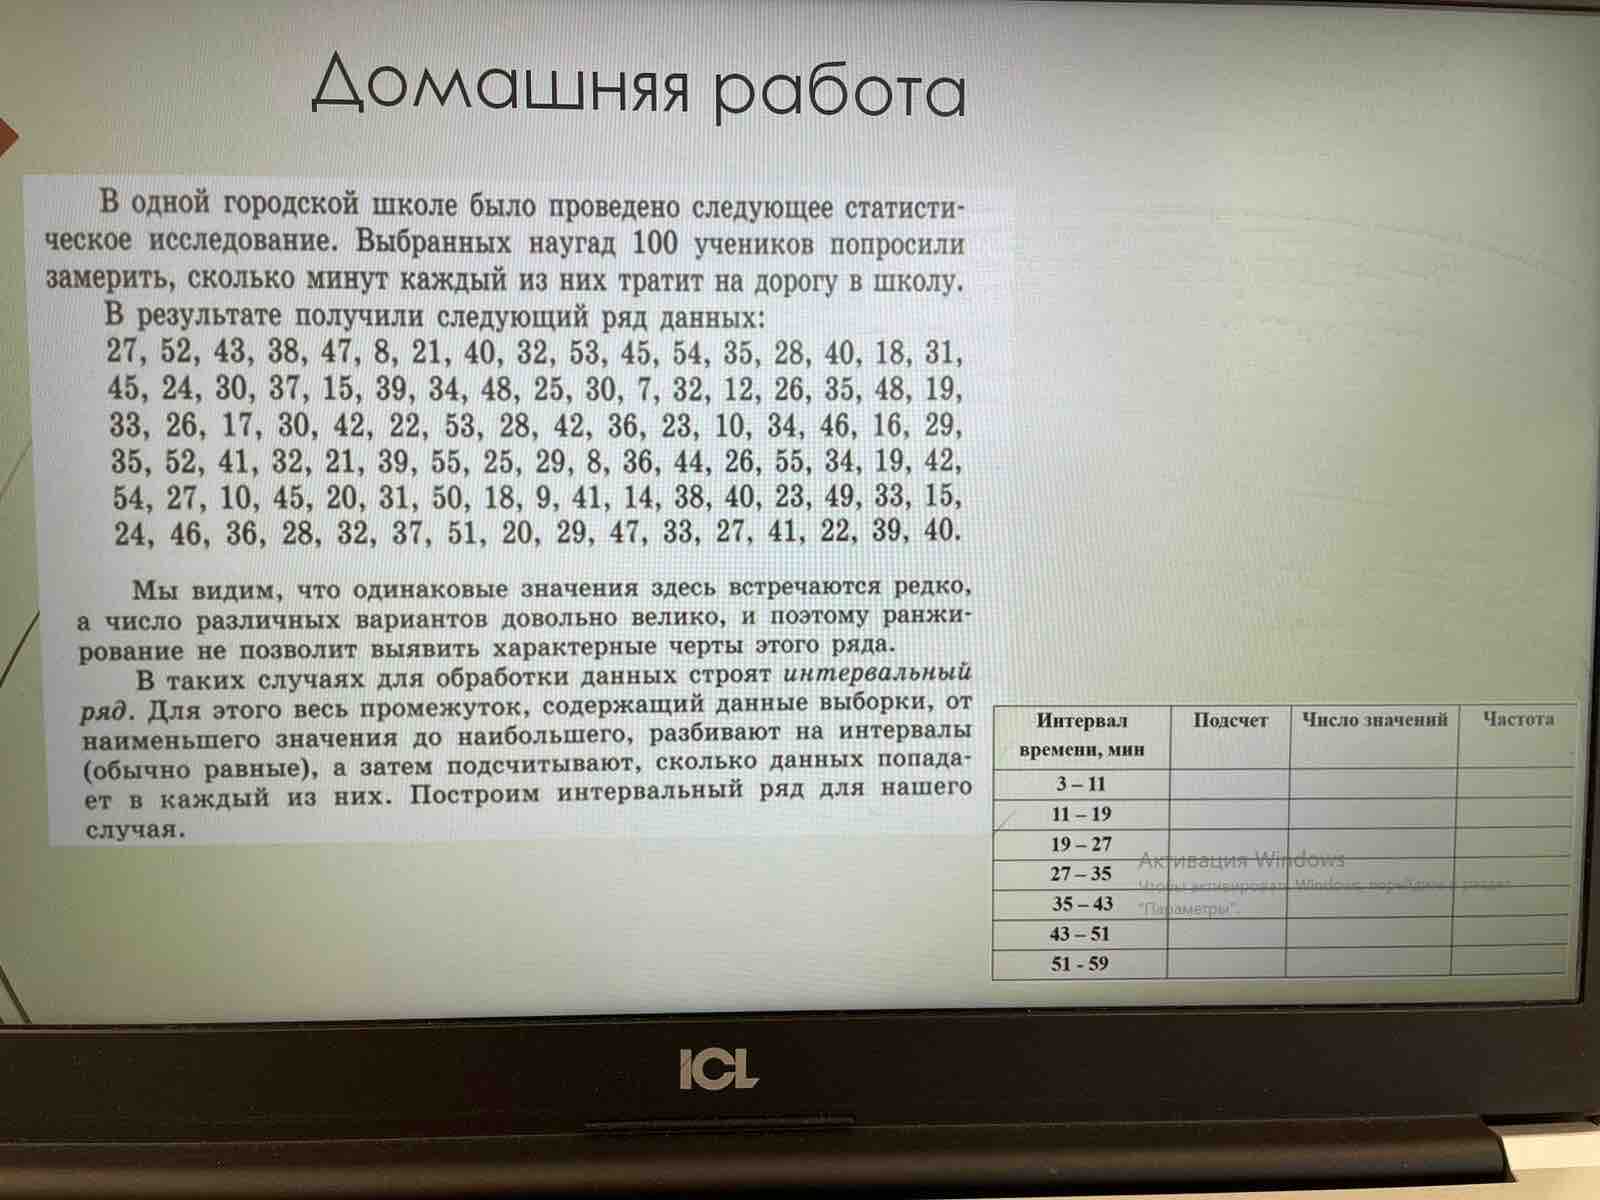
The image shows a statistics task involving time measurements taken from 100 students about how many minutes they spend traveling to and from school.

The data collection yielded the following results in terms of minutes: 2, 44, 12, 28, 31, 47, 59, 9, 45, 30, 50, 9, 37, 42, 41, 18, 30, 8, 57, 57, 29, 2, 47, 22, 31, 45, 30, 9, 19, 40, 19, 34, 52, 36, 6, 2, 4, 3, 51, 55, 8, 52, 6, 48, 51, 48, 46, 50, 14, 8, 25, 21, 24, 10, 38, 13, 51, 28, 12, 29, 31, 12, 14, 7, 47, 37, 24, 19, 8, 45, 47, 40, 12, 11, 36, 40, 39, 44, 31, 43, 16, 12, 6, 6, 42, 31, 47, 20, 19, 27, 16, 43, 39, 47, 44, 8, 30, 51.

The task likely involves analyzing this data, possibly by organizing it into intervals and determining the frequency for each interval, as hinted by the table in the bottom-right corner of the image.

The intervals and frequencies are as follows:

  • Interval: 2 - 11, Frequency:
  • Interval: 12 - 21, Frequency:
  • Interval: 22 - 31, Frequency:
  • Interval: 32 - 41, Frequency:
  • Interval: 42 - 51, Frequency:

The frequency for each interval needs to be determined by counting how many data points fall within each given range.

Задай свой вопрос

Напиши любую задачу или вопрос, а нейросеть её решит

Похожие вопросы 15

Бесплатно Мобильное приложение ГДЗ
Мобильное приложение ГДЗ

Задавай вопросы искуcственному интеллекту текстом или фотографиями в приложении на iPhone или Android

qr-codegoogle-playapp-store

Саша — ассистент в телеграмме

2•2
The image shows a statistics task involving time measurements taken from 100 students about how many minutes they spend traveling to and from school. The data collection yielded the following results in terms of minutes: 2, 44, 12, 28, 31, 47, 59, 9, 45, 30, 50, 9, 37, 42, 41, 18, 30, 8, 57, 57, 29, 2, 47, 22, 31, 45, 30, 9, 19, 40, 19, 34, 52, 36, 6, 2, 4, 3, 51, 55, 8, 52, 6, 48, 51, 48, 46, 50, 14, 8, 25, 21, 24, 10, 38, 13, 51, 28, 12, 29, 31, 12, 14, 7, 47, 37, 24, 19, 8, 45, 47, 40, 12, 11, 36, 40, 39, 44, 31, 43, 16, 12, 6, 6, 42, 31, 47, 20, 19, 27, 16, 43, 39, 47, 44, 8, 30, 51. The task likely involves analyzing this data, possibly by organizing it into intervals and determining the frequency for each interval, as hinted by the table in the bottom-right corner of the image. The intervals and frequencies are as follows: - Interval: 2 - 11, Frequency: - Interval: 12 - 21, Frequency: - Interval: 22 - 31, Frequency: - Interval: 32 - 41, Frequency: - Interval: 42 - 51, Frequency: The frequency for each interval needs to be determined by counting how many data points fall within each given range.