

На фото

Ответ нейросети
21 апреля 2025 18:11
To solve this task, we need to fill in the blanks using the information provided in the graph and the text.
Let's break it down:
Understanding the Graph:
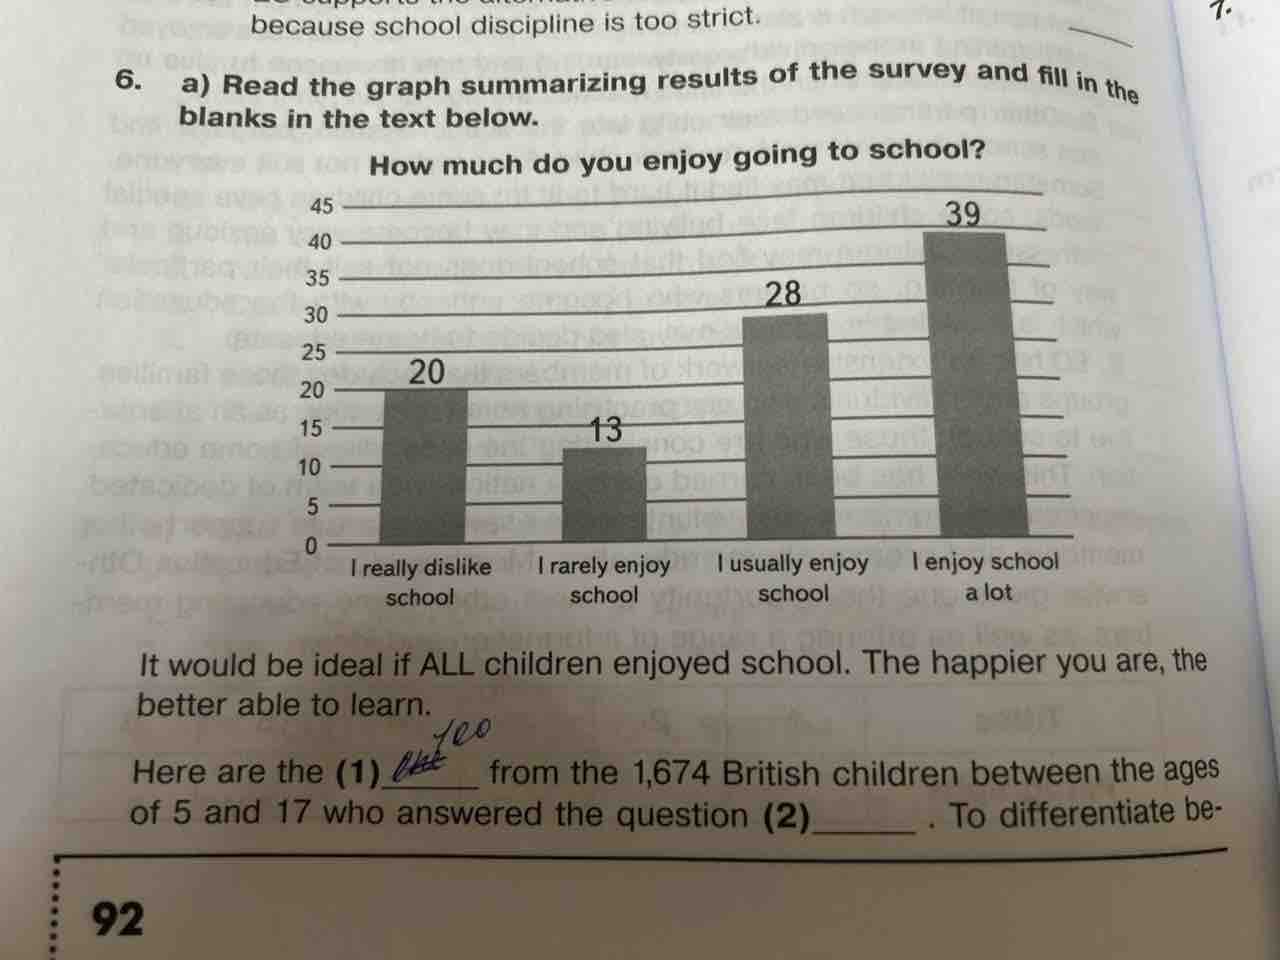
- The graph shows responses to the question "How much do you enjoy going to school?"
- There are four categories:
- "I really dislike school" - 20%
- "I rarely enjoy school" - 13%
- "I usually enjoy school" - 28%
- "I enjoy school a lot" - 39%
Analyzing the Text:
- The text mentions "the (1) ____ from the 1,674 British children between the ages of 5 and 17 who answered the question (2) ____."
Filling in the Blanks:
- For (1), it seems that the response or the survey is referred to. Thus, "results" or "feedback" would be appropriate.
- For (2), the question is likely related to the enjoyment of school. So, it might be "How much do you enjoy going to school?"
Solution:
The first blank can be filled with "results," as it refers to the results of the survey.
The second blank would be filled with the question "How much do you enjoy going to school?" as it matches the context of measuring enjoyment as shown in the graph.
Thus, the completed sentences could be:
"It would be ideal if ALL children enjoyed school. The happier you are, the better able to learn. Here are the (1) results from the 1,674 British children between the ages of 5 and 17 who answered the question (2) 'How much do you enjoy going to school?'"
This explanation provides the understanding you need to fill in the blanks correctly based on the graph and the context given.
Понравился ответ?
Задай свой вопрос
Напиши любую задачу или вопрос, а нейросеть её решит


